4. Factors that significantly determine sports performance
4.1. VO2max
One of the determinative parameters of the body’s sport performance is how much oxygen the respiration and circulation are able to get to the cells – to the muscles. This oxygen quantity satisfies the electron acceptor need arising during terminal oxidation, with which the athlete can produce ATP in the aerobic zone, economically, and for a long time. The oxygen quantity in question is called the maximal oxygen uptake or the maximal aerobic capacity, and its abbreviation is VO2max. Its unit is ml/(kg·min), that is, the oxygen taken up in one minute per one kilogramme of body mass, expressed in millilitres, or l/min, i.e. the oxygen quantity taken up by the entire body in one minute, expressed in litres. This value is a very important indicator of the endurance capacity and cardiovascular condition of the given athlete. The value of VO2max is influenced by several factors, such as:
vital capacity: the capacity of the lungs to take up air (the maximum amount of air which can be exhaled after a maximal, forced inhalation),
stroke volume of the heart: how much blood is expelled by the heart with one contraction. This value is influenced by ventricle size (paired with the appropriate power of the ventricular muscle). The product of stroke volume and heart rate (beats per minute or pulse number per minute) gives the cardiac output.
the haemoglobin content of the blood,
the vascular density of musculature, i.e., the state of development of matter transport to the muscles,
the arteriovenous oxygen difference.
The arteriovenous oxygen difference (AV oxygen difference; AV O2 diff) indicates the quantity of oxygen which the given tissue can extract from the blood flowing in via the arterial portion of the capillaries. In the human body, the AV oxygen difference is greatest in the heart, and smallest in the kidneys; it is greater in the muscular tissues of trained than in untrained individuals. The product of AV O2 diff and the cardiac output gives the value of VO2max.
- The number of mitochondria, and the quantity and turnover (working speed) of aerobic enzymes are also characteristics which are closely related to the value of VO2max; they directly affect the utilisation of the oxygen taken up, and thus indirectly influence the VO2max value.
These factors can all be improved with sport. In sports in which the development of both the aerobic and the anaerobic endurance are equally important, it is a general coaching experience that aerobic endurance can be much better improved than anaerobic endurance (e.g. Jamieson 2017). The simplest cause of this is primarily that the aerobic system has more components than the anaerobic, and the improvement of any of these components improves the aerobic system, and, in addition, that in terms of trainability and developability, the cardiovascular adaptability of the body is outstanding.
4.2. Lactate threshold, lactate tolerance
With increasing training intensity, at one point the body reaches the point up to which the energy provision of the activity can be almost fully covered by aerobic metabolism, with the help of oxygen. This is the body’s anaerobic threshold in the given activity. Above this, the conversion of pyruvate into lactate increases, therefore more lactate is already being produced than the aerobic system can neutralise (by reconverting lactate into glucose in the Cori cycle, and by the utilisation of the lactate by the skeletal and heart musculature); thus, the lactate concentration of the blood begins to increase steeply (although this inflection point of the ‘lactate level – time’ function cannot always be specified exactly [e.g. Bosquet et al. 2002]). For this reason, this metabolic threshold is also called the lactate threshold. Above the lactate threshold, the sensation of fatigue begins to be acutely manifest in athletes. (To be absolutely accurate, in the change of lactate level, there are two characteristic points. One is when the lactate concentration begins to rise above the baseline level, the other is when it passes the equilibrium between generation and neutralisation. Hence, the concept of lactate threshold is not used uniformly; see for example Faude et al. 2009. We will use the latter concept.) In theory, if we stop exactly at the lactate threshold, that is, when the quantity of lactate produced can be constantly handled by the lactate neutralising mechanisms, then the activity may still be sustained for a long time. In practice, this does not often seem very practical. First, because during competitions, the aim is generally to produce the maximum performance, and this often means an anaerobic activity heightened to the extent to which the competitor is still able to tolerate the lactate accumulated in the blood until the end of the competition – thus, in the interests of a further improvement in performance, the athlete does not stop at the lactate threshold. For example, in the case of a distance runner, the maximum intensity which can be undertaken in the period of the final home straight is an intensity which takes the lactate level – which builds up slowly during the competition – to the just bearable level, i.e. the athlete maximises the performance allowed by her/his lactate tolerance for the given distance. This maximum lactate concentration measured in the blood, which the individual still tolerates without feeling sick, is called lactate tolerance. Second, it is difficult to base performance on the processing capacity of the Cori-cycle and the other muscles, because when we step beyond the lactate threshold while increasing performance, the lactate level of the blood rises exponentially (i.e., the same increase in performance results in an ever larger increase in the lactate concentration; e.g. Goodwin et al. 2007).
The concentration value of the lactate threshold shows a relatively large inter-individual variability (Stegmann et al. 1981). The work intensity associated with this value increases with the effect of training, so the athlete will need a higher performance to produce the same blood lactate level than in her/his less trained state (e.g. Hurley et al. 1984).
It is a characteristic of the critical level of lactate, i.e. the maximally bearable lactate concentration, that trained individuals remain able to compete at a concentration twice as high as the level at which untrained people already quit the activity. The level of lactate measured in the blood in a resting state is 1–1.5 mmol/litre, and with the effect of loading, untrained individuals generally stop the activity before reaching a value of 10 mmol/l, while in extremely well-trained athletes the concentration may even reach 20–22 mmol/l in the few minutes following the activity, when the lactate level peaks. Concerning all this, the concentration value of the lactate threshold (i.e., not the training intensity or the value of VO2max at which the steep rise of the lactate level begins) averages approximately 4 mmol/l (Radák 2015; see also e.g. Bosquet et al. 2002).
If the level of blood lactate passes a critical value, i.e. it rises above the level of lactate tolerance, then a type of poisoning of metabolic origin, lactate acidosis, occurs. The great quantity of lactic acid moves the pH value of the blood in a strongly acidic direction (it lowers its pH value), which provokes symptoms such as nausea, vomiting, abrupt respiration and general weakness. It generally leads to death only when, due to certain severe illnesses and poisoning (e.g. cardiac insufficiency, hypovolemic shock, sepsis, serious anaemia, diabetes mellitus, tumours, consumption of cocaine or methyl alcohol, carbon monoxide poisoning, cyanide poisoning, etc.; Kraut, Madias 2014), the person is a priori prone to lactate acidosis, and there is no possibility of treatment. In practice, an athlete reaching this concentration simply stops the activity because s/he feels sick.
4.3. Trainability of the aerobic and anaerobic performance zones
On the basis of what has been previously reviewed and Figure 8, it can be stated that the body has an aerobic performance zone which fundamentally determines physical performance. Within this zone, the ATP production needed for muscle work is ensured by the full degradation of glucose, that is, by glycolysis, together with the mitochondrial processes of terminal oxidation. This performance zone depends on the interplay and state of development of several factors (lungs, heart, vascular system, enzymatic adaptation, mitochondrial quantity), and it can be developed in a versatile way and within broad limits.
As we have seen, the upper limit of the aerobic zone – and at the same time, the beginning of intense anaerobic energy production – is indicated by the lactate threshold; above this, an exponential accumulation of lactate starts in the body. The upper limit of this further accumulation can gradually be pushed up to ever higher levels. One way to do this is simply to do sporting activity. The more frequently we step over the lactate threshold during training, the higher we push up the value of the dangerous lactate level, but of course, this only holds to a certain extent.
Since the ultimate goal is the heightening of performance – the enhancement of speed, power, time of effort –, this can also be expressed in the following way: in competition sports, we would like to achieve the highest possible performance before the onset of the dangerous lactate acidosis. This is why we expose the body to physical stress during training. It would, however, be a mistake to think that the primary means of heightening performance is an endless repetition of high intensity training until we feel sick trying to push our maximally bearable lactate level ever higher. And it would be a mistake to think so, firstly because in terms of trainability, the aerobic system has a much greater potential than the anaerobic one. On the other hand, since the anaerobic energy producing system is built upon the aerobic, it logically follows that if the upper limit of the aerobic performance zone is pushed higher, then the lactate threshold will also rise, that is, we can remain in the economic training zone for a longer time – and at the same time, our absolute performance will also be improved (Figure 10).
Therefore, it is easy to understand that the principal way to increase performance is the broadening of the aerobic activity zone (Jamieson 2017), since even if we managed to achieve a very great development in the anaerobic zone, on the whole it will have a much lesser impact than if we had focused our attention on aerobic performance.
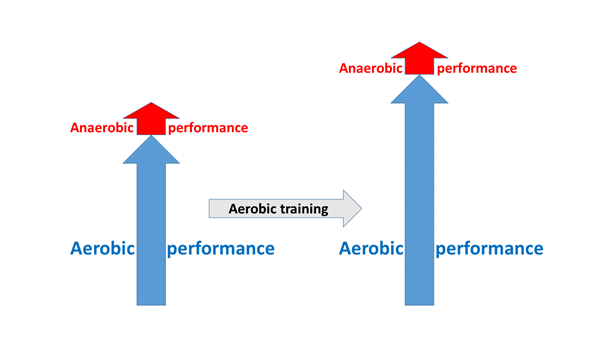
Figure 10: The relationship between aerobic and anaerobic trainability, compared to each other and to the total performance. The vertical arrows on top of each other indicate developability, their sum indicates the improvement in total performance.
In practice, it is relatively easy to separate the two zones – aerobic and anaerobic (more precisely the solely aerobic and the aerobic + anaerobic) – by measuring the heart rate on the one hand (see later), while on the other hand, athletes can also tell just “by feeling” in which zone they are training. When we perform the activity in our comfort training zone, and feel as if we could still sustain the activity for a very long time, then we are in the aerobic zone. When we struggle for air, and our thoughts are constantly focused on how it is even possible to tolerate the given activity at all, then we are already in the (anaerobic) period of significant lactate accumulation (but we should not forget: the aerobic energy production is continuing in the same way, even during this phase).
So, from this point of view it is good news for both competitors and coaches, that if endurance plays a role in a given sport, then most of the road to the acquisition of this endurance leads through training which takes place in the more “pleasant”, aerobic zone. It is nevertheless important to emphasise that since development is achievable through a repetitive overstepping of performance limits of ever growing difficulty, the activity needed for development cannot generally be called pleasant at all. In fields, pitches and training gyms, people do not train with a smile; they are suffering: work and fatigue cannot be skimped. However, the “unpleasantness” of aerobic training soon acquires an entirely new interpretation when we try to nudge the anaerobic limits upwards, since anaerobic training is much more unpleasant than this.
4.4. The value of heart rate
4.4.1. The significance of heart rate zones
The determination of the precise boundary between the aerobic and the anaerobic zones is possible in the laboratory, where the lactate level can be measured. In everyday sport, however, there is generally no need for this to be measured very accurately, so a very simple method is in use to assess it approximately: the assessment of performance on the basis of heart rate (HR).
It has been observed that particular metabolic phases can be characteristically linked to certain heart rate intervals which are given by relating the beats per minute (BPM) during an individual’s activity performed with maximal effort as the maximum value, to the resting BPM. To do this, when establishing and tracking athletes’ training plans, monitoring the heart rate is a huge help. This can be achieved with equipment that nowadays can be relatively cheaply purchased, such as the chest strap which can be paired with a phone and has a Bluetooth connection; the heart rate monitoring watch paired with a chest strap; and the more expensive devices that measure the heart rate on the wrist with optical technology.
It is, however, important to know that training with heart rate monitoring can mainly – and ideally – be applied in sports in which the activity is performed roughly homogeneously, but at a variable pace, as, for example, is the case in running, cycling, swimming, walking, cross-country ski, speed skating and long distance rowing, where it is superbly applicable. However, in strength training, in which the exercise itself – due to its difficulty – quickly produces an elevated heart rate even with a low number of repetitions –as is the case with pull ups – it is harder to use.
Some coaches plan their athletes’ training with mathematical accuracy, on the basis of the heart rate zones, while others rely on their experience and the athlete’s self-assessment, and do not opt for heart rate monitoring during training.
4.4.2. Application of heart rate measurement
To define the zones the maximal HR (HRmax) must first be determined. Given that this value decreases proportionally with age, a simple estimation of the age dependent HRmax seems a very attractive method. A broadly diffused mode of calculating the HRmax, used both on internet forums as well as in books, states that the value of our age expressed in years should be subtracted from 220. However, this simple method is based on data recovered from a sample which, from a scientific point of view, had not been chosen adequately (e.g. Tanaka et al. 2001, Nes et al. 2012), and it consistently underestimates the value of HRmax with increasing age (this error is already present above the age of 30, and, for example, among the 60-69 age group the error can reach 35 BPM; Nes et al. 2012). Therefore, other formulae have been proposed for the estimation of the age based HRmax, including:
208 – 0.7 × age (Tanaka et al. 2001);
211 – 0.64 × age ± 10.8 (Nes et al. 2012).
Estimations based exclusively on age do not, of course, take into account sex, the previous condition of training, or individual genetic differences, so the real value of HRmax may differ by many BPMs from the ideal given above. Some authors consider the standard deviation of the method unacceptably large, and they propose the rejection of the age based estimation of HRmax (e.g. Arena et al. 2016). In the case of elite athletes, the precise assessment of HRmax takes place in the laboratory, under the guidance and supervision of specialists. If the maximal value has been defined, then the resting heart rate has to be subtracted from it, and the given result is divided into five equal parts. According to another method, we step up from 50% of the maximal heart rate by 10 percentage points in each step, and in this way we establish the five fundamental training zones. These are – relative to 50% of the HRmax, and referring to running – the following (source: polar.com):
Between 50-60%: very light training involving moderate movement; this is characteristic of the first period of warm up.
Between 60-70%: a light training zone; the activity can be sustained for a long time, and over an adequately long duration this zone improves circulation and typically improves the aerobic endurance capacity (Radák 2016).
Between 70-80%: this is still a relatively comfortable training zone; over an appropriately long duration it improves the circulation of heart and skeletal muscles, being a typically aerobic endurance zone, in the upper part of which the accumulation of lactate already begins.
Between 80-90%: a decidedly anaerobic zone; the accumulation of lactate is ever more significant, this zone is very demanding, both physically and mentally. Work done in this zone improves the lactate tolerance capacity.
Above 90%: output of maximal power, with a very elevated lactate level; this is sustainable only for a couple of minutes. It is very hard to tolerate, both physically and mentally.
The second and the third zones (60–80% of HRmax) are typically aerobic training zones, so in these the aim is the improvement of the tools of aerobic energy production. Concerning the “fat burning” zones, which are rather popular among hobby sportspeople, it can be basically stated that the body uses fats to obtain energy principally during low intensity and long duration training sessions, so fat burning is connected both to training intensity and to training duration (see also chapter 5.2). This, by definition, can only be realised with long duration training sessions, which, however, generally exclude – a priori – the upper two zones (80–100% of HRmax), because of their difficulty. An important indicator in sports physiology is the lactate threshold heart rate, with the laboratory assessment of which, the expected performance and the training load are relatively easy to measure and set (Radák 2016). It must be noted that in the HR-based training plans of professional athletes, activities set at very precise HR values are often used, with allowed deviations of only 1-2 BPM, so the division into zones described above is not used. In their case, well defined metabolic characteristics assessed in the laboratory – e.g. a precise anaerobic threshold – are associated with the specified HR values.
4.4.3. Application of heart rate recording through practical examples
In the figure shown below (Figure 11), one can follow through the HR diagram of a combat sport training session, divided into the proper training zones. The greatest load on the body was represented by the three more powerful sparring periods, during which the heart rate often moved within the 80-100% range.
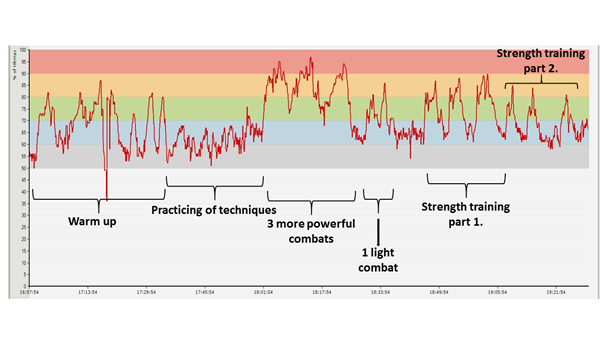
Figure 11: Variation of the heart rate diagram during a grappling system combat training session(Colour codes of HR zones: 50-60%: grey, 60-70%: blue, 70-80%: green, 80-90%: orange, 90-100%: red)Note: the warm up is twice as long as usual.Strength training part 1: pull ups with extra weight × 10, dips with extra weight × 15, standing up from the knees with extra weight × 10, hanging leg raises until 90 degrees × 12; 3 series in total. Strength training part 2: bent arm dumbbell pullovers × 15 + single-arm dumbbell rows × 15; 3 series in total.
Below, we can follow through the temporal variation of the heart rate values measured during an extensive total volume circuit training session which is considered to be an extreme loading. The first two diagrams (Figures 12-13) show the same training session with a two week difference between each other. The third (Figure 15) displays the heart rate profile of a training session which consists of the same exercises and the same total quantity as the previous ones, but divided into smaller bouts and very short resting periods.
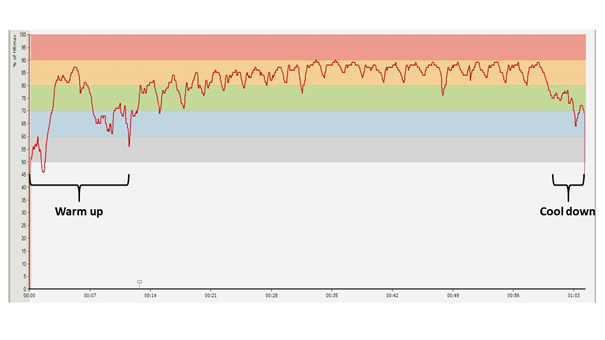
Figure 12: Heart rate diagram registered during a general strength circuit training session of twenty circuits
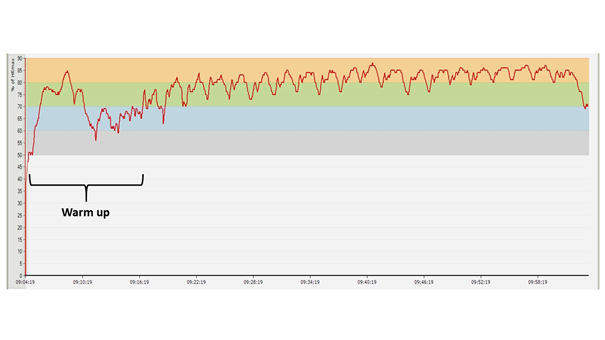
Figure 13: HR diagram of a strength training session identical in every aspect with the previous one, two weeks later
The diagrams presented in the figures above were made during two training sessions which were conducted in the same way, as far as possible (10 pull ups, 10 dips, 10 squats, and 10 hanging leg raises until right angle, repeated through 20 circuits; with 1 minute of rest between the circuits, same athlete, same equipment in the same training gym). Note that from the second diagram the upper, red HR zone is missing. Two weeks passed between the two training sessions (which meant five training sessions similar to these), and the adaptation response of the body is clearly visible even over this amount of time: the athlete performs the same work intensity and volume loading at a lower average heart rate – the difference is 5 BPM on average. The proportional distribution of time spent in the particular sport zones is shown by Table 2 and Figure 13 (also counting the warm up). Concerning the subjective experiences, following the first training session, the athlete reported that after approximately 10 circuits it was psychologically very hard to continue the exercises. During the training session two weeks later, such mental difficulties did not arise; he found the training hard but quite bearable.
One of the most important differences between the two sessions is that, according to the calculations of the heart rate recording apparatus, the time spent above the lactate threshold during the first session was the 18.5% of the net work time (without warm up), while during the second it was only 0.2%. This marked difference may suitably explain the difference in the subjective experiences regarding the two training sessions.
Table 2: The distribution of work time among the particular HR zones during the training sessions shown in the two diagrams (Figure 12-13). The difference between the two sessions is, in fact, slightly greater than shown by the data, since the recording made during the second session does not include the cooling down period.
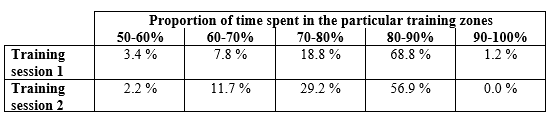
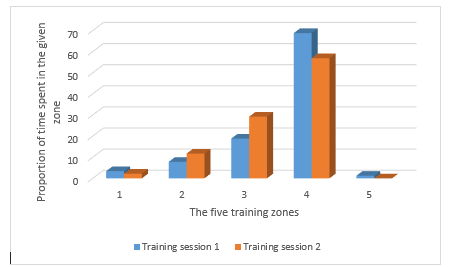
Figure 14: Proportional distribution of training time among the particular HR zones)
In the following, let us take a look at the diagram (Figure 15) which has been created from the data registered during a more intense variant of this same session. In this session, the athlete performs the same number of exercises divided into 33 circuits, in such a way that he only does six repetitions of each exercise per circuit, but the resting time between the circuits is extremely low: it shrinks to only 10 seconds. The athlete had previously practiced this type of training over several weeks, and he had already done at least 20 workouts of a similar structure. The net working time (the time extending from the first exercise of the first circuit until the last exercise of the last circuit, ignoring the warm up), from a time span of approximately 50 minutes during the previous sessions drops to cca. 35 minutes, since in the first two cases the total resting time between circuits is 19 minutes, while in the work of the condensed training programme it is 5 minutes 20 seconds.
The change which produces one of the biggest effects is visible in the parameter of the training time spent above the estimated lactate threshold: during the heightened intensity training period this value is 61% of the net working time. The athlete reported that – despite the fact that he had already done several similar sessions –, while working out, it was hard for him to imagine he would be able to carry the activity through to the end at all. So, in a session which is carried out in these kinds of HR zones an athlete is confronted with extreme psychological hardship.
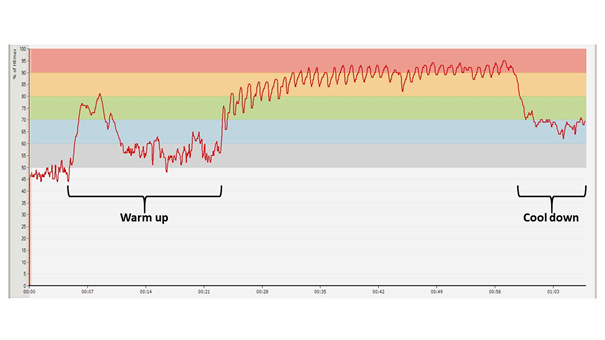
Figure 15: HR diagram of a circuit training session consisting of exercises and a total working volume equal to the previous sessions, divided into smaller working and resting periods
On the basis of the previous example, let us now consider three other diagrams: the first one was made during an athlete’s participation in a national epée competition, the second during an international competition, and with the help of the third one we can follow through the work of two other competitors during a training session (Figures 16-18). Competitions represent an extreme loading for the athletes, since everything “goes live”, which means that their opponents will supposedly do anything for victory, so it cannot be expected that they will work at “half power”. Consequently, it is necessary to produce a generally much higher physical performance than during training sessions. This, obviously also entails a significant psychological burden on the competitors, which is furthermore intensified by competition anxiety, that is, the extra arousal generated by the will to win, which, occasionally, may provoke a strong debilitating effect.
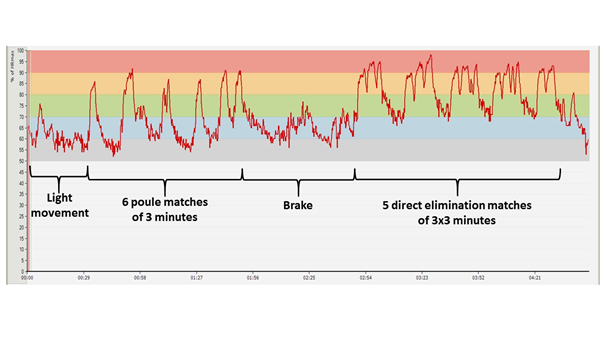
Figure 16: HR diagram made during a national fencing competition (Tata, Hungary, 11. nov. 2017; measured by Bendegúz Serra)
In Figure 16, an HR diagram recorded during a national competition can be seen (Figure 16). The warm up phase is missing from the chart because at that time the athlete was not yet wearing the HR monitoring device. The course of the competition can easily be followed from the graph. The athlete fenced six three-minute bouts during the qualification matches, and qualified for the direct elimination phase which represents a bigger burden, and which was preceded by a break. Since the duration of the break was approximately an hour, it was important to make sure that the athlete’s muscles and joints did not cool down. In the direct elimination phase she fenced five matches, the first four of which lasted for 3 × 3 minutes, and she managed to win each bout (in this competition phase, matches last for 3 × 3 minutes or until 15 points are won). In the final match (the two-peak graph) her opponent won, so the young woman ultimately finished the competition with a silver medal. (The graph relating to the penultimate match is four-peaked, because after the start, the athlete’s opponent indicated some problem, so the fight had to be stopped for a while.)
The next graph was recorded during an international competition, with the same athlete, two months later (Figure 17).
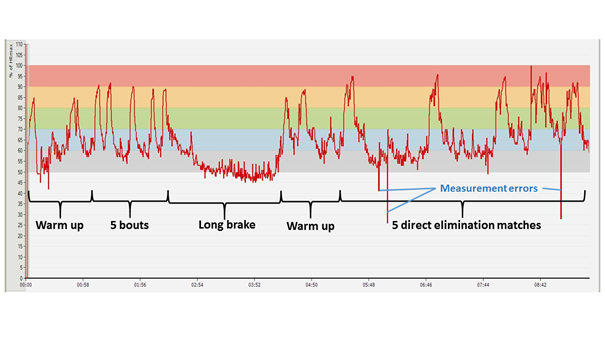
Figure 17: HR diagram recorded during an international fencing competition (Bratislava, 12. Jan. 2018; measured by Bendegúz Serra)
Following warm up, the athlete qualified over five bouts for the direct elimination stage which was preceded by a break of more than an hour and a half. This was followed by a repeated, serious warm up, and then by three easy matches during which she managed to win in two rounds. She won the penultimate match in three rounds, while she lost in the last match in two rounds, and so failed to reach the quarter-final.
From the calculations of the HR recording device it is evident that the athlete spent approximately 45 minutes over the estimated lactate threshold during both competitions. This is a high value, but no adequate conclusion can be drawn from it in absolute terms, since besides duration, it is primarily the temporal distribution of the single periods of the activity done above the lactate threshold which significantly determinates the capacity of the aerobic system to replenish energy. Following the graph of the international competition (Figure 17), we can state that the high intensity work periods in the initial, elimination stage of the competition were of short duration, and were separated by sufficient resting periods, which ensured an appropriate regeneration. However, in the second phase of the competition, especially towards the end, the loading increases exponentially, because on the one hand, matches last longer, and, on the other hand, resting periods are shorter and shorter, and what’s more, opponents are also expected to “become ever more difficult”. Thus, an outstanding capacity for endurance has a paramount role in ensuring that the athlete is able to produce an appropriate performance even during matches closer to the final.
In the last diagram (Figure 18), we can follow the course of a fencing training session.
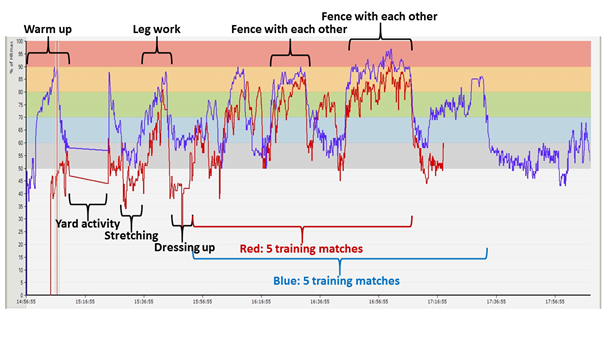
Figure 18: HR diagram of two epée competitors, recorded during a training session(The competitor marked by red arrived late, so she joined the warm up later. During the period indicated by the horizontal line, a ball game took place as a further warming up activity in the yard, so the equipment lost the signal.)
In this graph it can be observed that the athlete marked in red performed the activity in each working period – stretching, leg work, matches – at a lower average heart rate than the male competitor marked in blue. This is most comparable and evident in the two periods in which they fenced with each other. Work time spent above the estimated lactate threshold provides important information in this case, too, since if we look at the time period of their second fencing match, the man spent 63.9 %, while the woman only 5.9 % of the match in this physiological training zone (and she won).
From the data it can be calculated that for the athlete marked in blue, the session represents an adequate intensity and loading in preparation for a competition. The athlete marked in red has such a high level endurance that she had to spend only 2.7 % of the training time above the lactate threshold, so this training load for her is not sufficient, since in competitions, against competitors similar to her, she will have to fight at a much more intense tempo. In order to be able to prepare herself for the conditions that can be expected at the competition, she has to receive a higher load during training sessions, and has to perform the exercises with the other fencers under conditions made more difficult – for example, loaded with extra weights.
4.5. Fatigue
Fatigue, which begins to appear in a certain phase of performing the activity, can develop for various reasons, and it indicates to the athlete that s/he is beginning to step out from her/his currently optimal activity zone. The appearance of fatigue, therefore, depends on the duration of work on the one hand, and on the intensity of work on the other. With an increase in fatigue
the coordination of movement declines,
attentional efficiency diminishes,
the danger of injury increases, and
overall, performance decreases.
The integration of the optimal fatigue level into the training session is not always an easy task for the trainer, but it is a pre-condition for producing a successful adaptation response (Radák 2016). Besides fatigue, overtraining can also be mentioned as affecting sports performance, but this has been dealt with in the previous semester among the factors influencing the occurrence of injuries.
4.5.1. Peripheral fatigue
In peripheral fatigue, a muscle group runs out of its reserves, so its further use becomes difficult or impossible. The cause of local fatigue is that the given region has been worked harder than the others. Fatigue may arise, for example, because the given muscles run out of their glycogen reserves in a long duration activity or when there is serial loading – for example the series of elimination phase competitions at world championships can produce this kind of effect (Radák 2016). The Ca2+ reserves of the muscle cells, needed for contraction, may also run down, which makes it hard to produce the contraction, and this too, is perceived as fatigue (Radák 2016). Similarly, fatigue is caused by the drainage of the neurotransmitter reserve of the neuromuscular synapsis, which may occur due to long duration work; and in the case of high intensity work, the depletion of the creatine phosphate reserve also produces such an effect (Fonyó 2014). Lactate in a high concentration also generates fatigue (here we are not speaking about the general blood lactate level but about the local effect), as the diminishing tissue pH reduces the strength of muscular contraction (Radák 2016).
4.5.2. Central fatigue
With central fatigue, in effect, it is the brain that intervenes in the body’s operations by generating a general sensation of tiredness, since it perceives that we have already left the optimal performance zone. Thus, central fatigue originates in the nervous system. If, for example, body temperature rises too much during sports activity, the pH value (acidosis) or the water content of blood decreases excessively, or there is a potentially dangerous overstepping of limit values in other parameters – such as glucose level, ion proportions, ammonia level, blood osmolarity –, the brain tries to reduce work intensity. This is perceived as general fatigue. The appearance of this, during long-lasting sports activity (a football match, a tennis game, road cycling, marathon running, triathlon, etc.), can consciously be delayed by consuming, for example, drinks which provide energy and various ions (Moore 2015), but often, even simply by replenishing the body’s water needs. A general consequence of improving respiration efficiency through endurance training, is that the accumulation of by-products also diminishes (Egan, Zierath 2013), and this will extend the limits of both peripheral and central fatigue.
In the appearance of the sensation of fatigue, the free radicals generated in the body during physical stress also have an important role (Morales-Alamo, Calbet 2014). The free radicals (such as O2─[superoxide], OH─[hydroxyl radical], ONOO─[peroxynitrite]) are molecules containing unpaired electrons, hence they are highly reactive, and react with almost every molecule that “gets in their road”; therefore, they can seriously damage our enzymes or the DNA of our cells. Besides impairing the operational efficiency of various important molecules, however, free radicals play a substantial role in activating signal transduction pathways that result in an antioxidant effect in the body (Gomez-Cabrera et al. 2008; Trinity et al. 2016), and, due to their vasoactive property, they also improve the circulatory parameters of the muscle and other organs under physical load (Trinity et al. 2016).
Previously, mitochondria were thought to be the source of free radicals, which, in the course of terminal oxidation, would have produced an increased amount of free radicals (e.g. Radák 2016), but this view has now been refuted because it has been verified that the contribution of mitochondria to the production of free radicals is very limited (Gomez-Cabrera et al. 2008; Trinity et al. 2016). At the same time, however, it has not yet been established precisely where free radicals are produced, besides the mitochondria, the epithelial- and the smooth muscle cells of the walls of blood vessels (Trinity et al. 2016).
The destructive effect of free radicals is countered, on the one hand, by the antioxidant molecules of a non-proteic nature present in the body (bilirubin, uric acid, melatonin, vitamin C, vitamin E), and on the other hand, by proteins with an antioxidant effect produced by the cells. An important component of training adaptation is that, by means of these proteins, the capacity of the body to neutralise the harmful effect of free radicals increases (Gomez-Cabrera et al. 2008; Morales-Alamo, Calbet 2014; Trinity et al. 2016), and the augmentation of free radical concentration due to physical load is precisely a precondition for this adaptation (Gomez-Cabrera et al. 2008; Morales-Alamo, Calbet 2014).
A psychologically high priority trait of central fatigue is an interesting phenomenon which strongly endangers the competition results of the athlete, and does not allow her/him to get full reward for all the preparation accomplished through hard work. The appearance of this psychological factor is regularly confirmed by the observations of coaches (and athletes) during fencing competitions. The phenomenon is that, above a very high HR value (roughly 93–94%), the behaviour of athletes in many cases suddenly changes, and instead of the well-organised and reasonable movements they have used up to that point, they begin producing illogical and disadvantageous behaviour, and committing very elementary errors which seem to be inconsistent with their experience. From the outside, it seems that the athlete suddenly loses her/his rational mind, and forgets everything s/he had learnt until then, as s/he adopts irrational, “beginner-like” and disadvantageous movements just at the point the most concentrated tactical attention is required.
4.6. Delayed Onset Muscular Soreness
Delayed onset muscular soreness (DOMS) is a very frequently appearing phenomenon caused by sports activity. DOMS is a pain in the muscle resulting from movement and pressure, which can also be accompanied by various degrees of muscular stiffness. It typically appears on the day after a workout, and it reaches its peak in one to two days, but if the activity involves very great effort, and/or is very intense, or unusual, then DOMS may already appear even some hours after the activity.
DOMS may also be triggered by an increase in the volume and intensity of the load, as well as by a change in load type. It is generally accepted that further training is the best way to alleviate DOMS (Armstrong 1984, Cleak et al. 1992, Cheung et al. 2003).
It is generally emphasized in the literature that DOMS is generated primarily due to eccentric work (e.g. Armstrong 1984, Cleak 1992, Cheung et al. 2003, Radák 2016); in fact, certain authors attribute it exclusively to eccentric effort (e.g. Nosaka 2008, Murase et al. 2010), which contradicts sports experience.
Several theories have been formulated to explain the formation of DOMS, but none provides a fully satisfying explanation. An idea, clearly present in common thinking, considers the lactate produced during activity to be responsible for DOMS. However, lactate is eliminated from the blood soon after the ending of the activity – generally within an hour (e.g. Cheung et al. 2003) –, and DOMS begins at least several hours after that, so a considerable amount of time passes between the two processes. For this and also for other reasons, this explanation can be regarded as illogical, and thus not acceptable (Schwane et al. 1983, Cheung et al. 2003, Radák 2016).
According to another theory, during sports activity, tiny, cellular-level, so-called micro-injuries are generated in the muscle, and in essence, these are responsible for the pain. This theory supposedly originates from the idea that it regards eccentric exercises as the cause of DOMS, and since these exercises are known to be capable of provoking injuries in the muscular tissue, it is obvious that micro-ruptures are assumed to be the direct causes of DOMS. Nevertheless, it is probable that this theory does not provide a full explanation, as DOMS may arise, for example, even when neither the previously carried out exercises, nor their sequence is changed, and only a minor rearrangement and/or increase is being introduced which is very unlikely to cause ruptures in the trained muscular tissue (for example, in the circuit strength session training presented above – Figures 12-13 – with the total volume unchanged, 11 repetitions per circuit are done instead of 10, in such a way that the athletes’ maximum capacity is 25-30 repetitions of even the hardest exercise). In addition, when doing, for example, DOMS-causing isometric exercises, during which neither muscle contraction nor elongation takes place, it is difficult to understand how the injuries occur. Besides this, there is also other evidence against the injury-theory, which, therefore, may only provide at most a partial explanation for the generation of DOMS (Cleak et al. 1992, Cheung et al. 2003).
Perhaps most evidence has been accumulated for the theory that interprets DOMS as an inflammatory process (Cleak et al. 1992). Several molecular components of the hyperalgesia-provoking inflammation (hyperalgesia: increased pain) have already been described (e.g. bradykinin, NGF [Nerve Growth Factor; Murase et al. 2010], ATP or NO [Radák 2016].
In addition to the theories involving lactate, micro-injuries and inflammatory processes, other ideas have also been presented to explain DOMS, including the muscle spasm theory, the connective tissue damage theory (around muscle fibres) and the enzyme efflux theory; for an ample overview of these, see, for example, the publications by Cleak and co-authors and Cheung and co-authors (Cleak et al. 1992, Cheung et al. 2003). It seems that none of the above-listed theories is capable of providing a proper explanation for the mechanism of the rise of DOMS, so some have also combined the elements of previous theories (Cheung et al. 2003).
In summary, however, it can be said that the satisfactory explanation of this everyday phenomenon, which perhaps most of us have often experienced, is still to be discovered.
4.7. Warm up
The importance of a warm up has already been dealt with in the previous semester; however, the knowledge acquired then can still be complemented by some extra information. To summarise what has previously been learned, it can be said that a warm up is important because when warming up
the amount of synovial fluid increases,
the viscosity of the synovial fluid increases (it “flows with more difficulty”),
the time needed to reach maximum tension in the muscles decreases,
the speed of muscle contraction rises,
the power output increases.
Therefore, a warm up of a proper duration and intensity will protect the joint components from injuries, and improve the performance of muscle work. Two very important components of an appropriate warm up are the
raising of body temperature and the
mobilisation of joints.
If either of these two components is not adequate, then health and/or performance can suffer. A typically well-structured warm up is, for example, a light full-body mobilisation composed of three periods, which begins with some light jogging combined with various limb- and spine-mobilising exercises, then continues with movements executed during walking, and closes with exercising in a standing/sitting/laying position. The muscle heat produced during jogging is used for an intense raising of body temperature during the walking phase, and the same happens at the walking–standing transition too, so we raise body temperature efficiently, while also accomplishing joint mobilisation.
4.8. Rest and regeneration
The loading received by the body during training has to be regenerated during rest, otherwise the overtraining syndrome (see previous semester) may easily develop. From this point of view, it is very important to keep to the appropriate resting time, which has to be accommodated to the type of training. The correct arrangement of resting periods in the long run (i.e. over several months or a whole year) determines the general trainability and the development of the general level of the sports activity. So this resting pattern is actually the optimal combination and pattern of the daily workout amount and the weekly workout frequency. Of course, the most important resting factor between individual days is sleep, the quality of which powerfully influences sports performance. During sleep, the activity of the autonomic nervous system of the body is characterised by a parasympathetic predominance, so the restoring-repairing and the anabolic mechanisms dominate in the cellular processes.
Regeneration during competitions is, in turn, fundamentally determined by the type of performance zone in which the event is mainly taking place: anaerobic alactacid, anaerobic lactacid or aerobic (Radák 2016). During sprint events – such as 100 metre or 200 metre running, 50 metre swimming events, or 200 metre kayak races – athletes primarily rely on their anaerobic alactacid system, and a significant lactate accumulation in the blood does not occur. Since the reserve of creatine phosphate in the muscles in question is capable of regenerating in a few minutes, even shorter resting periods are adequate between these events, so in world championships, athletes are able to race multiple times in a day without any reduction in their performance. During events dominated by the anaerobic lactacid system – such as 500 and 1000 metre rowing events, 200 and 400 metre swimming races, and 800 and 1500 metre running – a large-scale lactate accumulation takes place in a competitor’s blood. To eliminate this, a minimum of 30-60 minutes is required, so proper regeneration time windows can be kept with some hours of rest time between the races. In the aerobic events – 10,000 metre running, football matches, basketball matches, 10 km swimming races, marathon running, etc. – the determinative factor for resting time is the depletion of glycogen reserves, since to refill them, one, two or even more days are necessary (Radák 2016).
4.9. Circadian rhythm
Performance is, naturally, influenced by the variation of the circadian rhythm (daily rhythm) of the athlete. We may remember from our biological studies that the inner clock of the body (the neuron group called the suprachiasmatic nucleus in the hypothalamus) primarily follows the alternation of the dark-light rhythm, and, with the help of this, it organises the pattern of the production of melatonin and other hormones, the patterns of the scheduling of meals, of the values of body temperature, and of the periods of sleep and wakefulness. Of course, the rhythm of the variation of these parameters influences how sports performance may vary during the particular periods of the day. In general, it can be said that we are capable of the highest power output in the afternoon-evening (16-20 h), naturally, with individual differences (Radák 2016). The timing of races, therefore, is not a matter of indifference for athletes. Problems regarding this may arise especially when getting to the competition venue involves significant travelling in an E–W direction, and thus requires the crossing of time zones. In these cases, the circadian rhythm can re-set itself after some days, but if there is not enough time for this, as well as at the beginning of the re-set period, sports performance is impaired because of the disturbances in sleep.